ND Crash Rates Are Lower In Oil-Producing Counties

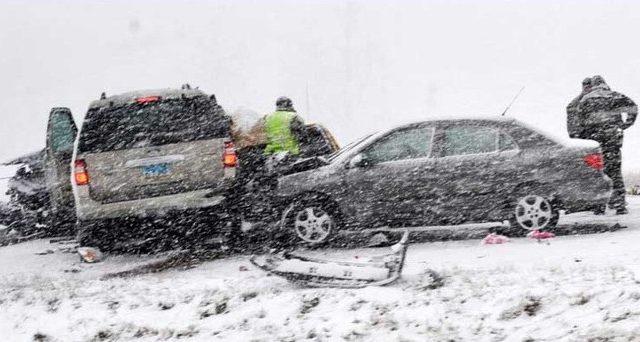
Yesterday Watford City Mayor Brent Sanford pinned the traffic deaths of two teenagers in his community on the state government, claiming state leaders aren’t sufficiently funding infrastructure in the oil patch. “It makes me sick to think of children dying on our roads,” Brent Sanford told The Bismarck Tribune. “It’s a nightmare.”
“We’ve got two-lane highways instead of four-lane, and 10,000 trucks going through here a day,” he said. “When are we going to believe this (oil activity) is here to stay?”
I could argue that the state is already spending billions to western infrastructure, that the state is working to address western infrastructure about as fast as democratic government can, but let’s set that aside for a moment.
Yesterday I argued that Mayor Sanford’s emotional outburst is based on an anecdote, and that we shouldn’t base policy on anecdotes. Data is more important, and according to statewide data from the NDDOT’s crash report traffic accident rates have been pretty static:

In the comments, though, a reader challenged me to look at oil county data versus statewide data. That’s a good point. Perhaps we’re seeing a disproportionate impact in oil patch counties as opposed to the rest of the state. So I requested a per-county breakdown for crash rates from the NDDOT going back to 2006 (which is as far back as is available according to Jamie Olson in the NDDOT’s Communications Division), and calculated average rates for members of the North Dakota Association of Oil Producing Counties and all the non-oil counties.
What I found was pretty interesting. On average, the crash rates in oil-producing counties have been consistently lower than the rest of the state before and during the Bakken oil boom:

Now, maybe you can argue that not all oil-producing counties have the same oil impact, and that’s distorting the numbers. So I also looked at the two counties with the heaviest impact, Williams County (Williston) and McKenzie County (home to Watford City and Mayor Sanford). What I found is that both counties have seen fairly static crash rates both before and during the oil boom, and both are pretty much in line with the statewide crash rate. Williams County is a little above the statewide rate, while McKenzie County is actually below:

Now, to be fair, there have been more crashes in the oil patch, but you have to put those crashes in the context of increased traffic which is what the crash rate does. There are more crashes, but there are also more opportunities for crashes due to more vehicles driving more miles on the roads.
That’s cold comfort, I’m sure, those mourning loved ones lost in a car crash, but statistically speaking the roads in the oil patch aren’t more dangerous than the roads in the rest of the state. In fact, their a little bit safer.
Do we still need to build out infrastructure in western North Dakota? Absolutely. But it’s time to stop finger-pointing over dead bodies.
Update: Per the comments, readers wanted to see a comparison of fatality rates (not just crash rates) between oil and non-oil counties. I’m not sure that this is the right metric as fatality rates can be impacted by things not related to geography or oil activity (the rate of seat belt use, as one example). But here’s the data anyway, and note that it proves my point. Fatality rates in the oil patch were higher than the rest of the state prior to the oil boom, and there really hasn’t been an increase coinciding with the oil boom:


