Good, bad news in Ohio’s unemployment rate
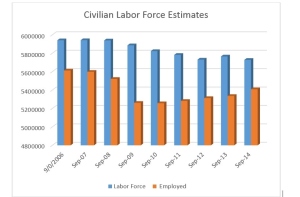
EMPLOYMENT: A comparison of September employment figures since 2006 show Ohio has a long way to go to recover from the recession.
By Maggie Thurber | For Ohio Watchdog
Good and bad news can be found in Ohio’s latest unemployment numbers.
The good news is the unemployment rate fell to 5.6 percent in September. That’s down from 5.7 percent in August.
In fact, to find a September when the unemployment was this low, one must go back to 2006.
The bad news is the unemployment rate is completely dependent upon how many people are identified as being in the workforce. When you don’t count people who are no longer looking for work, the unemployment rate will drop.
All states and the federal government calculate unemployment the same way: divide the number of people who aren’t working into the number of people in the labor force. But the labor force number varies depending upon how many people are working or looking for work.
Instead of tracking the number of people out of work, a better comparison would be to track the number of people who are actually working.
The state provides this data online and furnishes an online query tool so people can search the information and do their own comparisons.
Using that tool, the information for September shows 5,612,000 Ohioans working in 2006 . In 2014, 5,409,000 were working – more than 200,000 fewer.
The figures also show nearly 6,000,000 in the workforce in September 2006, but only 5,728,000 in this September.
If all the people not looking for work were counted in the calculation, Ohio’s unemployment rate would be around 9 percent.
So while it’s true that the number of employed in the month has steadily risen from the low of 5,257,000 in 2010, it’s still not enough to get Ohio back to its peak before the recession.